|
On some level (in particular, the top-of-the-atmosphere level where net-global accounting is done), the effects of greenhouse gases are simple: because they trap outgoing radiation from the surface, the planet must warm to radiate more by Planck's Law and remain in equilibrium with the incoming solar radiation. This instantaneous 'radiative forcing' mechanism is relatively well-understood, although the subsequent heat transports and the final regional climate effects in equilibrium are less so. Radiative forcing occurs more or less uniformly around the globe, hence the term 'well-mixed greenhouse gases' [WMGHGs] for CO2, CH4, N2O, and several others that, once emitted, exist in the atmosphere for decades or centuries and move all around during that time. For near-surface air pollution, this is not the case. [Air pollution can broadly be thought of as any gas or suspended particle that is harmful to human health, and so is of most interest at the surface.] The compounds comprising it, like ozone, sulfates, and nitrates, have short lifetimes (a few days is typical) and thus are present in high concentrations only in or immediately downwind of source regions. This makes prediction more difficult, and of course also means that the differences in impacts between regions are larger.
Another fundamental difference between greenhouse-gas 'pollution' and air pollution is the divergence of their trends in recent decades: the former is generally still rising, while the latter is falling, at least in developed countries, as a consequence of strict legislation. Today's pollution hotspots are in places like Harbin, China and New Delhi, while the legendary suffocating smogs of Los Angeles and London -- that in terms of some components like sulfur dioxide were multiple times worse than even present-day pollution episodes in East Asia -- are mostly a thing of the past. To give a flavor of the severity, for the week ending Dec. 13, 1952, average SO2 concentrations in London were five times higher than the daily maximum recorded during Beijing's severe episode in Jan. 2013, resulting in something like 10,000 excess deaths. With such short lifetimes, these kinds of regional-pollution events respond to economic fluctuations, with impacts on the health of our most vulnerable citizens measured in the thousands, in addition to exhibiting seasonal patterns in intensity and location both in the U.S. as well as in China. And like smoking and obesity, it seems the more one reads, the more correlations one discovers between air pollution and elevated health risks: diabetes, for example.
So, in a practical/political sense, regional air pollution control should be easier to agree on because the benefits of management are more immediately tangible. It's a case of big costs and big benefits, and politicians tend to dwell more on the first, which is why there is hesitation to impose regulations despite the consensus net benefit, and also why it is only once countries reach a certain level of wealth that they begin imposing limits on pollution of their own accord. The decision is often a conscious one: at low income levels, the benefits are judged as outweighing the costs, but this analysis changes with income (i.e. following a Kuznets curve). Is there reason for optimism then? The overall downward trends in the developed world suggest there is, although this optimism must be tempered by the recognition that reducing pollution might result in other unintended and undesirable counter-effects like increasing temperatures over the Atlantic that have been held down by reflective sulfate aerosols. Also, increasing summertime temperatures will promote the formation of more photochemical smog, especially in already-polluted urban areas. In the near-term, traditional foci of air pollution like coal-fired power plants and smelters continue to have significant negative health impacts on people living in their vicinity -- which is suggested by the figure at left below, and even more so by the figure at right. The values over 1,000 expected cancer cases per million residents in the righthand figure are in census tracts adjacent to steel factories. These are the scales on which people are affected, and so must be the scales ultimately considered in policy decisions if future progress is to be as remarkable as what has been achieved since the palette of London smogs included Madeira wine, yellow, dun, heavy brown, green-yellow, and faint yellow. At the bottom of the page is an interactive real-time map from aqicn.org, a group in China that compiles observations from around the globe into user-friendly formats using the EPA 0-500 scale for overall air quality. It works best in Firefox or Chrome.
0 Comments
Two articles ("Holiday Lights from Space" and "A Hazy Road to Mecca") in the December issue of the Urban Climate News highlight an important aspect of climatology, and of urban climatology in particular: the wildcard of human influence. Some climate decisions can be strongly influenced by human relationships writ large, of course, as is always the case in geopolitics; but the phenomena described in the two articles above cause us to reflect upon the ability of ordinary people to together modify the environment around all of them when behaving in a coordinated way. Holidays are a perfect example, whether they mean a person treks to Mecca or simply sets out decorations in their yard. Analyzing the changes during holidays are fun, but, more importantly, time variations allow for a better understanding of how sensitive the climate system is (on local and regional scales especially) to human actions. The midweek peak in southeast-U.S. precipitation is one good example of this. Zooming out to the scale of years, economic crises leave their signature in emissions trends as well.  CO2 emissions (black) and "carbon intensity" (red) over the last 50 years, with linear trends fitted to the curve of the five years preceding major crises. Source: doi:10.1038/nclimate1332 It's not just in or near cities where the human temporal fingerprint can be detected, but any place where people gather in numbers for a length of time and bring with them the trappings of an energy-intensive lifestyle. (This is to a certain extent just a case of the general rule that adding more people can turn any previously sustainable activity, like slash-and-burn agriculture, into an unsustainable one.) The authors of the study examining environmental conditions along Hajj routes ingeniously made the connection between the huge concentrations of people — however temporary — and the probable resultant impacts. After all, from a human-health perspective, the degree to which adverse conditions are problematic is proportional to the product of their severity and the number of people exposed. Indeed, the study found that heavy traffic, constrictive tunnels, and high temperatures were the main factors in producing locally extreme levels of carbon monoxide, methane, and toxic volatile organic compounds [VOCs]. These spikes were not representative of regional conditions, but the 100- or 1000-km average isn't what matters for something like air quality; the 1-m average is. I don't expect that models will be able to soon, if ever, capture the effects of traffic jams in Meccan tunnels on a handful of days surrounding Ramadan. But keeping in mind that goal lays out a useful scientific trajectory for, in the coming decades and beyond, moving from bulk averages to localized and fleeting values. Achieving that goal calls for more inspired studies that look at temporary perturbations to the time- and space-average anthropogenic climate effect. Typically, regional studies focus on the space average, or the time average but primarily for periods defined by ambient environmental conditions like heat waves. Both require parameterization to get down to the level of human experience, which is something like one meter in space and one minute in time. Although perhaps clearest for air quality, I think there is a purpose to closer examination of other types of detailed time-varying climate information as well. The amount of lights during holidays may be a proxy for overall increases in energy usage, which would have implications for the management of electrical capacity, especially when two stressor events overlap (e.g. a hot holiday afternoon). Large events like festivals or games, whether in urban areas or far away from them, may also have discernible environmental effects for attendees or residents of the surrounding regions. Or they may not. The point is, in a world of 'smart' and 'just-in-time' allocation of resources, such questions are not just worthy of consideration from an impacts standpoint — they may be able to tell us something useful about the behavior of climate systems as well as that of ourselves.  Concentrations of non-methane VOCs, carbon monoxide, and methane during the 2012 Hajj (left) and the following spring (right). U.S. short-term exposure limits are 35,000 ppbv for CO and 240 ppbv for hydrocarbons like methane. Source: doi:10.1021/es5017476 Nearly every climate study investigates the relationship between greenhouse-gas emissions and temperature changes, but it is rare that temperature changes' signification for various kinds of impacts is looked at in any more detail than a bulk approximation. An article published last year in the journal PNAS attempted to refine projections of impacts, separating them into four 'sectors' (water availability, crop yields, species loss, and disease risk) that were examined regionally. The authors assumed temperature changes consistent with the most-extreme emissions projections, the Representative Concentration Pathway [RCP] 8.5 pathway — which might seem alarmist, except that this figure from the first IPCC report in 1992 shows that's the route that we're on. They then used standalone impact models to estimate the temperature at which impacts they defined as "severe" would occur for each sector and region, with severity being, qualitatively, a rapid shift relative to historical values. After all, it's the speed of change that matters most for the natural world; CO2 values have been much higher in the (warmer) past, but rose there very slowly, allowing species to adapt. The below figure from the paper indicates that by this methodology, perhaps surprisingly, large numbers of people (i.e. major urban areas) will likely not be directly impacted by climate change until temperatures climb 3 deg C or so above 1980-2010 values. At that point, southern Europe, western Africa, Central America, and parts of South America will experience water shortages and crop-yield decreases, while large areas of the globe (particularly the Arctic and high-altitude regions) will be undergoing significant ecosystem disruption. However, 1 percent of the global population is still more than 70 million people, and just one sector's impacts could very well be devastating (witness the current drought in southern Brazil).  Fractions of global area and population affected by "severe" impacts in water, agriculture, species loss, and/or disease risk as a function of the change in global-mean temperature. The strict case is where more than half of the models agree on direction and severity; the worst case requires just one model predicting severe impacts. Source: http://www.pnas.org/content/111/9/3233.full One has to be cautious about making too-firm conclusions from the results of this approach, though. The percent of population impacted is in large part a function of the definition of what constitutes an impact, and of the assumption that the four sectoral impacts are equal in importance. Breaking down the sectors and examining the map of regional differences shaded by degree of model agreement (below) disentangles the data from the authors' assumptions and makes clearer which sectors will be of most concern where. Crop-yield decreases and water shortages are the two results that are most robust across studies, and are least likely to diminish with increasing wealth (unlike, say, malaria risk). This consideration leads to different and generally more-serious conclusions, especially for rapidly urbanizing areas; for example, northern India and West Africa show near-term crop-yield vulnerability (panel b) that has the potential to affect many hundreds of millions of people. But because those areas are projected to experience less water and ecosystem stress, and already have endemic malaria, they aren't included in the graphs above, and don't show up as regions of concern in the maps below.  Projected 'severe' impacts for the four studied sectors: a) water, b) agriculture, c) ecosystem health, and d) disease risk, colored by the temperature increase at which they occur and shaded by model agreement. Panel e) shows where impacts on multiple sectors are expected according to the authors' definitions. Source: http://www.pnas.org/content/111/9/3233.full?tab=ds Another reason to be wary of concluding too much from a study like this lies in the impact models used. Because there's more heterogeneity in the way climate factors lead to impacts than there is in, say, how greenhouse gases affect climates, there's more uncertainty there as well. This is not distinct from the fact that the base of previous studies to serve as guideposts is smaller. So, whether the mean projected impact of a certain type for a given temperature change is reasonably physically accurate — or whether the maximum or minimum is better — is still the subject of scientific debate. And of course there's the question of what the temperature changes will actually be; climate models contribute relatively little to this uncertainty at timescales beyond about 50 years, at which point human behavior (the emissions scenario) becomes the dominant factor.
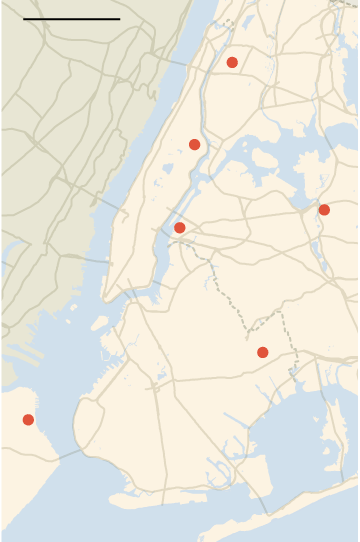
Nonetheless, despite this two-sourced uncertainty, for both scientific and policy purposes it's important to consider the full range of possibilities, however unlikely we deem them to be. We as a society have overall been very good and/or fortunate so far at avoiding the gloomy predictions of Thomas Malthus and Paul Ehrlich, but we perhaps owe them a debt for galvanizing others to work toward avoiding the sorts of global catastrophes they were worried about. Natural ecosystems, it's true, are a cause for serious concern at moderate levels of temperature increase, not to mention high ones (panel c) — and the implications of this for urban areas weren't taken into account in this paper. However, even as directly concerns cities, we should not be lulled into the time-buying implications of the 'strict case' predictions shown above, despite reservations about assumptions and uncertainties. Mitigation and adaptation are certainly necessary pieces of the puzzle. But just as we actively monitor for disasters like rogue asteroids, despite very low probabilities of collisions, so should we be engaged in preparation for climate-triggered disasters, even if our best guess is that the worst is still several decades away. Here in New York City, Mayor Bill de Blasio announced last week an ambitious plan to substantially increase the city's affordable-housing stock. With continual upward pressure on housing prices, this is a welcome proposition. City planners are hoping that by increasing the supply of housing, low- and middle-income residents will financially be able to remain in the city. The problem is that many of the incentivized areas are low-lying and coincide with areas flooded during Hurricane Sandy (see interactive map at bottom). By comparing the income map (also below) with the inundation, it is apparent that as things stand today, flood-prone areas are dominated by low- and middle-income populations. Nor is this pattern restricted to the New York urban area: sociological studies have corroborated the perception that income is a robust predictor of vulnerability to and suffering from natural disasters, both between countries and within the U.S., due to housing location and quality among other factors. Of course, locations near shores naturally exhibit lower summertime maximum temperatures due to sea breezes, and are thus less dangerous to human health in that regard. In fact, the below map of county-level death rates from all 'natural hazards' does not resemble at all our preconceptions, which are based on faster and more-exciting media-reported disasters like tornadoes, floods, and hurricanes. Coastal cities like New York and Boston, and even hurricane-prone Miami, experience fewer deaths on a per-capita basis than arid, impoverished, sparsely settled counties in the West that are subject to extreme heat. As a slow-moving kind of disaster, sea-level rise is thankfully unlikely to lead to catastrophic death tolls; economic damages, on the other hand, are by all forecasts expected to be severe as seas inch ever higher. And, as has been seen throughout history, floods are squarely in the category of 'things that need only happen once to destroy a place' — unlike, say, heat waves, where some people die but the underpinning physical infrastructure is rarely damaged.  County-level death rates from natural hazards in the U.S., 1970-2004. Source: doi:10.1186/1476-072X-7-64 So, as with many environmental dilemmas, the question of whether Mayor de Blasio's plan is a well-advised one can eventually be reduced to some form of mitigation or avoidance? Committing to make these huge investments in vulnerable areas amounts to doubling down on the bet that the region's defenses will be able to withstand the biggest storms of the coming decades, for as long as the buildings' useful lifetime lasts (and, if the past is any indication, probably much longer). If this amount of affordable housing can only feasibly be constructed in low-lying areas, then it is justified in the sense that the benefits outweigh the costs, with the benefits probably coming first and the costs becoming apparent later on. In the short-term, enormous economic benefits will accrue to the entire regionwide population of renters, who will enjoy lower rents, shorter commutes, etc. So it's an inherently myopic fix, but most plans are. However, when climates change and risks increase over time, this classic temporal discounting of the political kind should probably be used less — though this is a very difficult mental readjustment to make. There is also the consideration of whether global society should really be cementing a paradigm wherein people with less means are prodded into living in the most climatically at-risk areas. But to not carry out such projects with the excuse of climate change would be to completely forgo a certain amount of (economic) utility because of the possibility of disasters at some unspecified point in the future. Certainly, no plan or preparation is ever perfect. Models can give us the best-estimate probability distribution of flooding of a certain magnitude over a certain future time period, but weighing that information against other needs — like housing for economically squeezed residents — seems to still be best decided by human judgment. |
Archives
September 2023
Categories |


 RSS Feed